It makes sense, given the nature of our business, that we understand not all people process information the same way. While some of us do better just by taking in a lecture, and storing the auditory version of the lesson in our brains just fine, others of us are visual learners.
For visual learners, sometimes text just isn’t enough to allow for a concept to resonate in a deep and meaningful way. It takes more. And often, that “more” comes in the form of pictures. The rise of the infographic on today’s Internet is likely an off-shoot of this idea: for visual learners, the rendering of statistics and information into graphic form is the best way to ingest a concept. Here are some of the best optometry and eye-related infographics that we could find on the web. Click the smaller thumbnail image to see the full-size version.
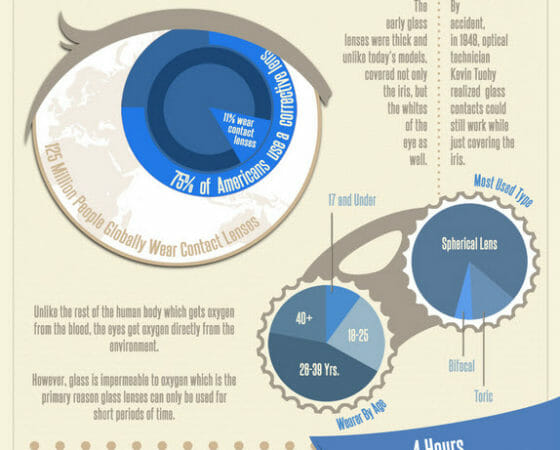
History of the Contact Lens Infographic
The State of the Nation’s Eyes Infographic
 Eyes: A Window Into Your Health Infographic
The Human Eye Is Composed of 2 Million Working Parts Infographic
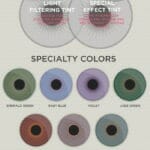
History of Colored Contact Lenses Infographic
Interesting Facts About Your Eyes Infographic
See the next post in this two-part series by clicking here.
[Infographics courtesy of (in order): okcoptometrist.com; opticianonline.net; pinterest.com;pinterest.com;tips4eyedocs.com; sugarlandeyes.com]


